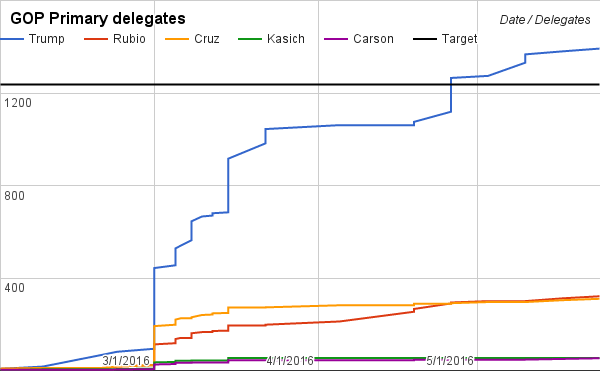
We’ve updated our spreadsheet that the latest numbers on the delegate projections, based on polling aggregates from fivethirtyeight.com and Real Clear Politics. These are run on a state-by-state basis, with each state’s delegate allocation rules factored into the math. The poll numbers are up-to-date through March 6, and we’ve added options for Rubio dropping out, as well as forcing new winners in the big winner-take-all states to see what that does to the numbers.
How might our numbers still be off? Well, first off, if the polls are. Some big states, like Florida, haven’t had new poll numbers for nearly two weeks. National polls don’t yet seem to reflect Super Tuesday (and certainly Super Saturday) voting.
They’re also probably off a few delegates per state, as we use state-wide polling numbers for each congressional district, which favors the state winner by allocating a handful more delegates to them than real life.
A third way it’s probably off is that it apportions undecided voters proportionally among those that make the threshold. This has no effect on the Democratic side, but does favor Trump on the GOP side for two reasons: it probably undercuts finishers who are polling near the delegate threshold, and the latest results show that late deciders are voting against Trump by large margins.
With those caveats, it’s useful for running scenarios to see what might happen March 15 and beyond.
Run the projections yourself here:


